Drilling hydraulics
The full pressure picture
Enter the mud rheology, drill string, hole program and bit; the software computes the full pressure picture of the well, before and during the run.
Hydraulics →ABAR — Drilling Analytics and Engineering Software
Daily rig reports carry the record of how your equipment performs: depths, hours, rate of penetration, weight on bit, formations, what was run and what it did. ABAR reads those reports into a database and adds the engineering calculations that use them.
How it works
The core platform
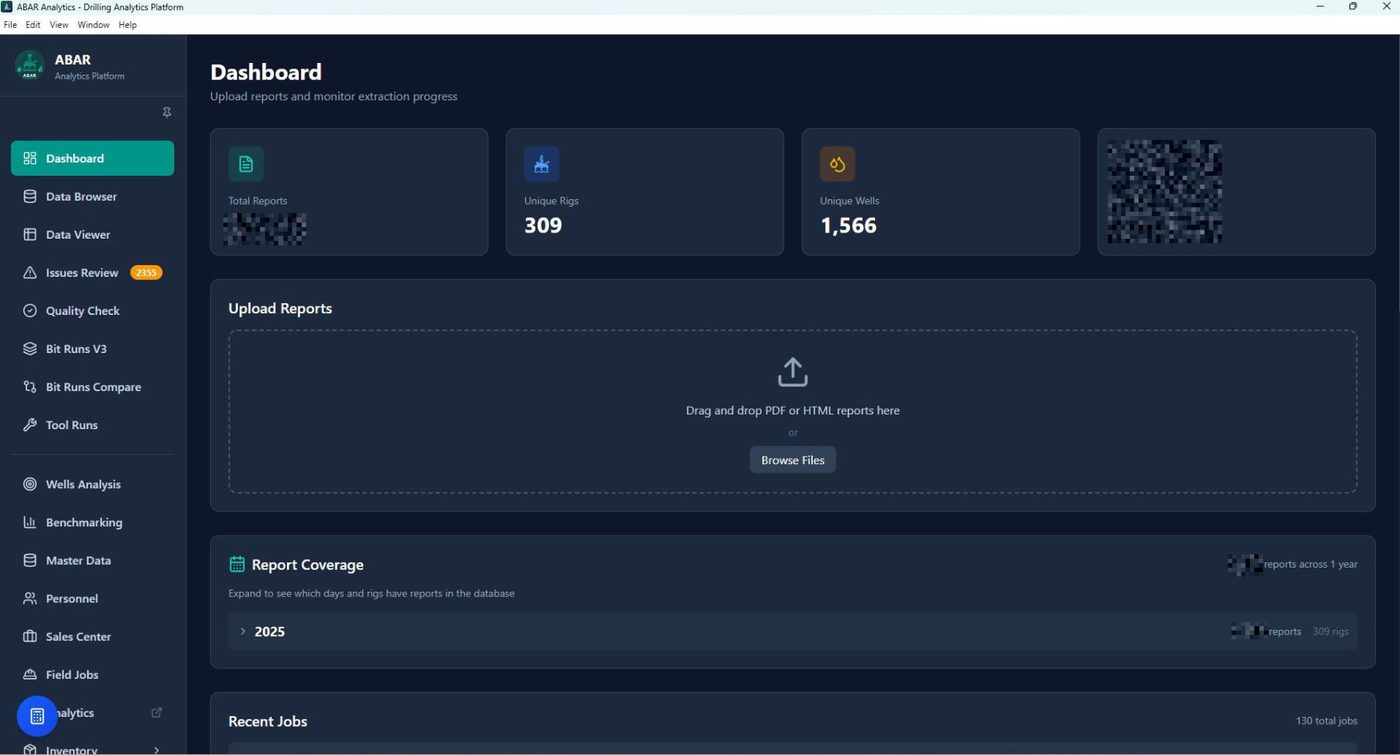
Drag and drop PDF or HTML rig reports onto the dashboard, or point the folder watcher at a directory. Reports are read automatically and structured into a local database of well information, operations, bit runs, mud data, formations, BHA data and surveys.
Coverage by rig and by day is shown as the database grows.
The core platform
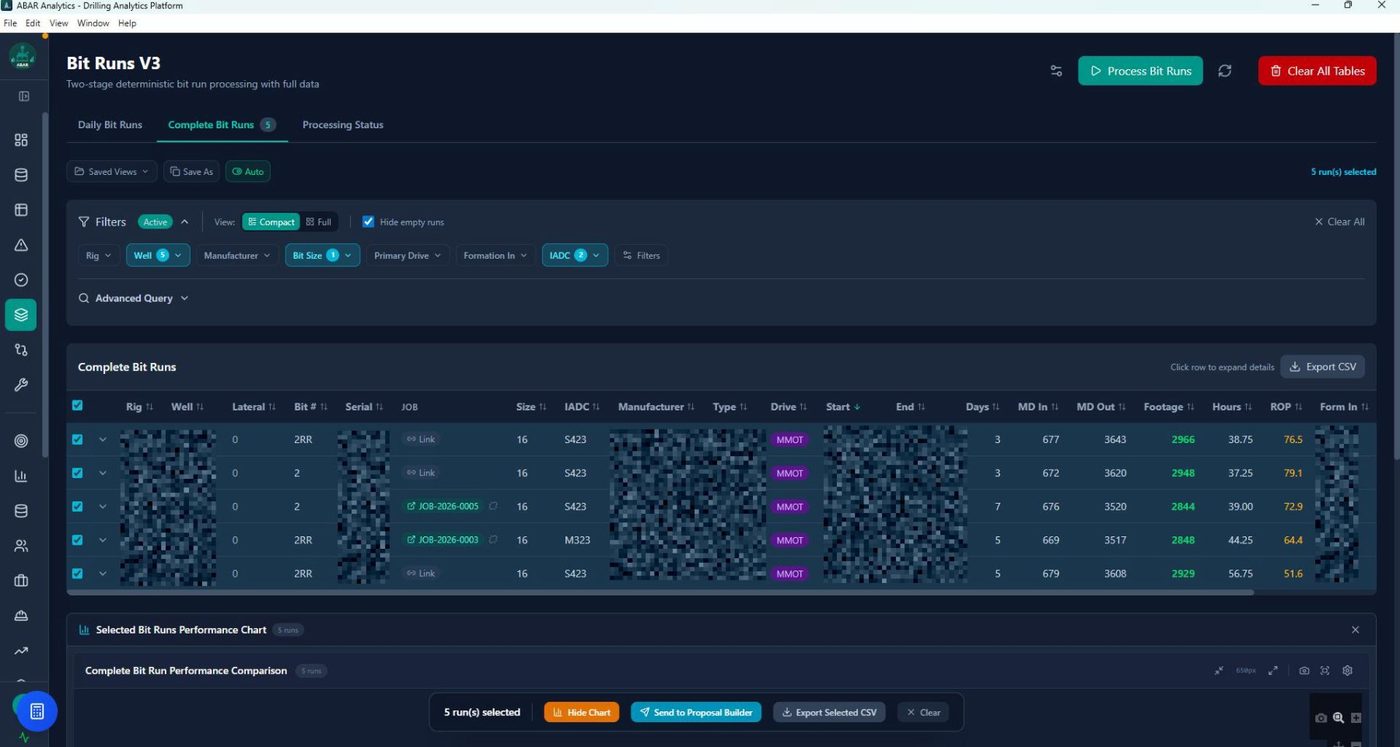
Every run is assembled from the extracted reports: bit size, IADC code, manufacturer, type, drive, depths, footage, hours and rate of penetration. Filter by rig, well, manufacturer, bit size, drive or formation, and export the selection to CSV. The same is available for the extracted BHA components.
The core platform
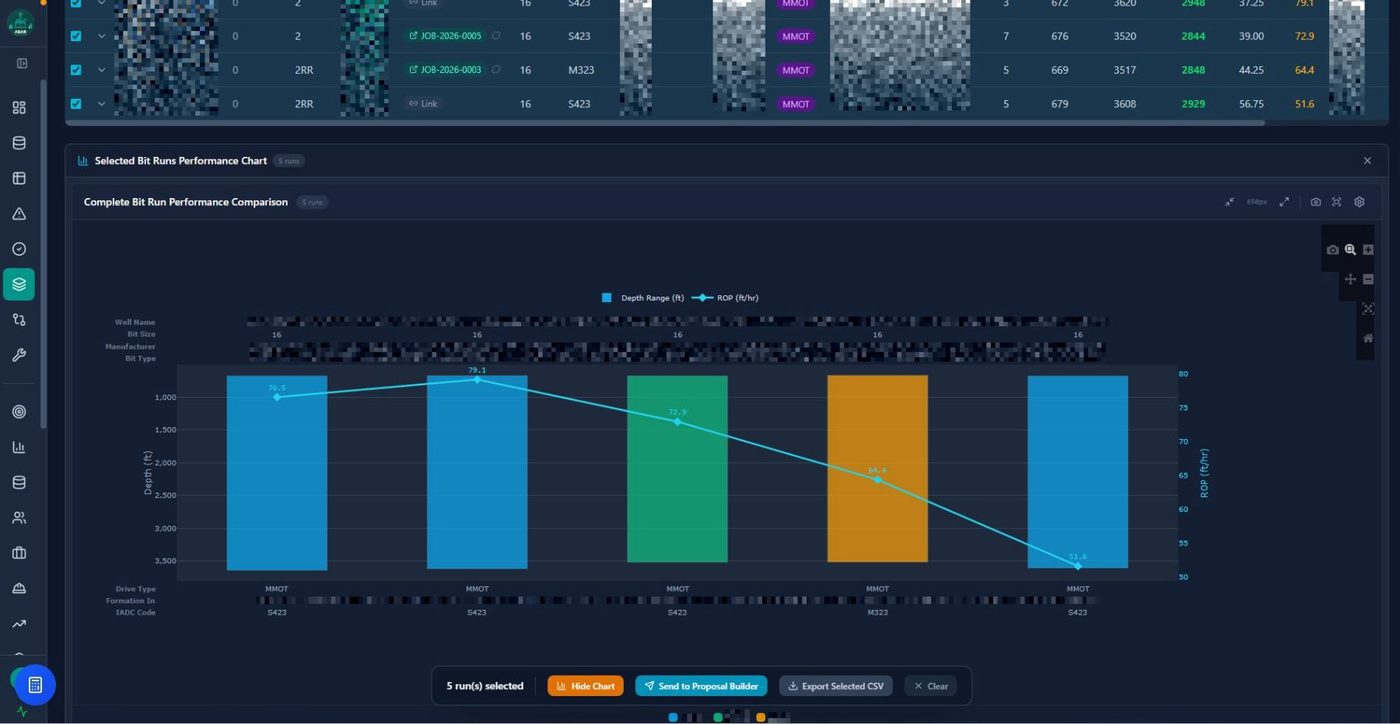
Select any number of runs and plot them. Depth range and rate of penetration are shown together, with well, bit size, manufacturer, bit type, drive type, formation in and IADC code aligned under each run.
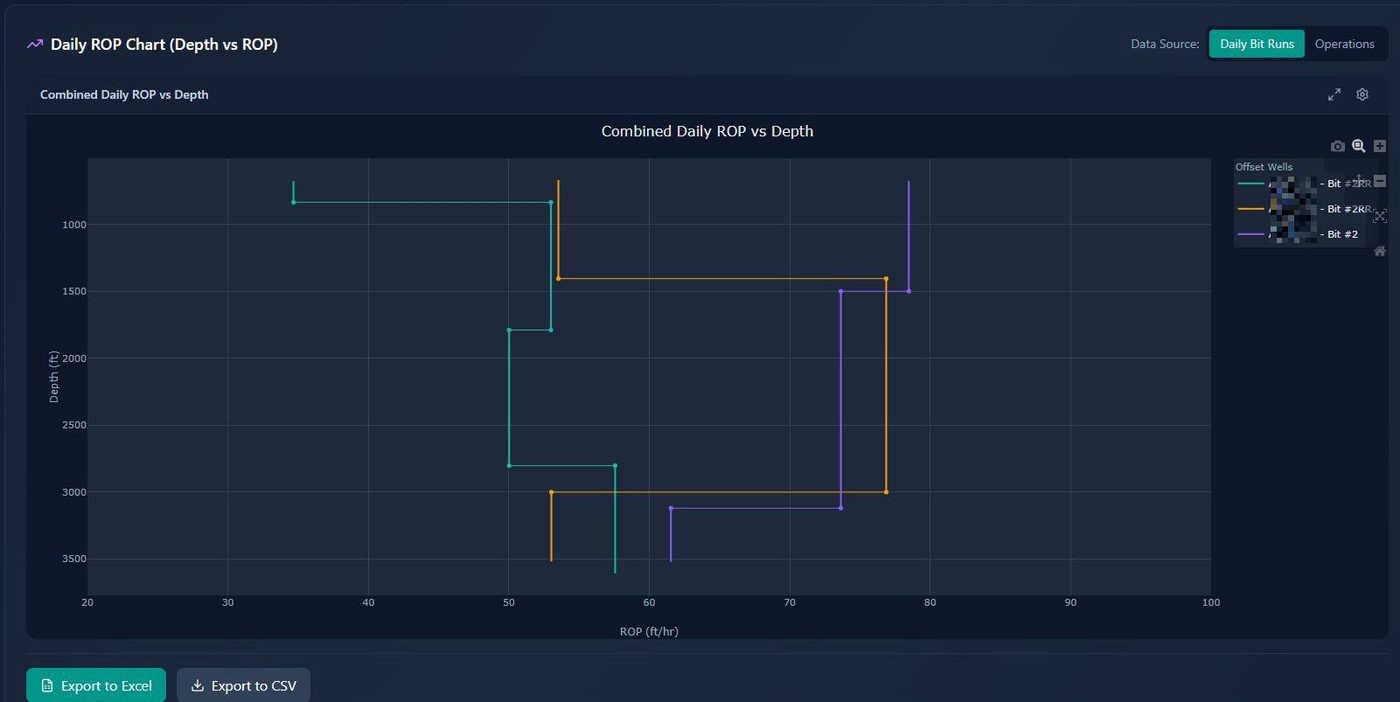
Daily rate of penetration against depth can be charted for any set of runs or offset wells and exported to Excel or CSV.
The core platform
Open any well in the database and review its operations, bit runs, formations, surveys, formation performance and logs, filtered by hole size or depth interval. Set up a target well with its directional plan and surveys, hole sections and casing programme, and generate a well schematic and a PDF.
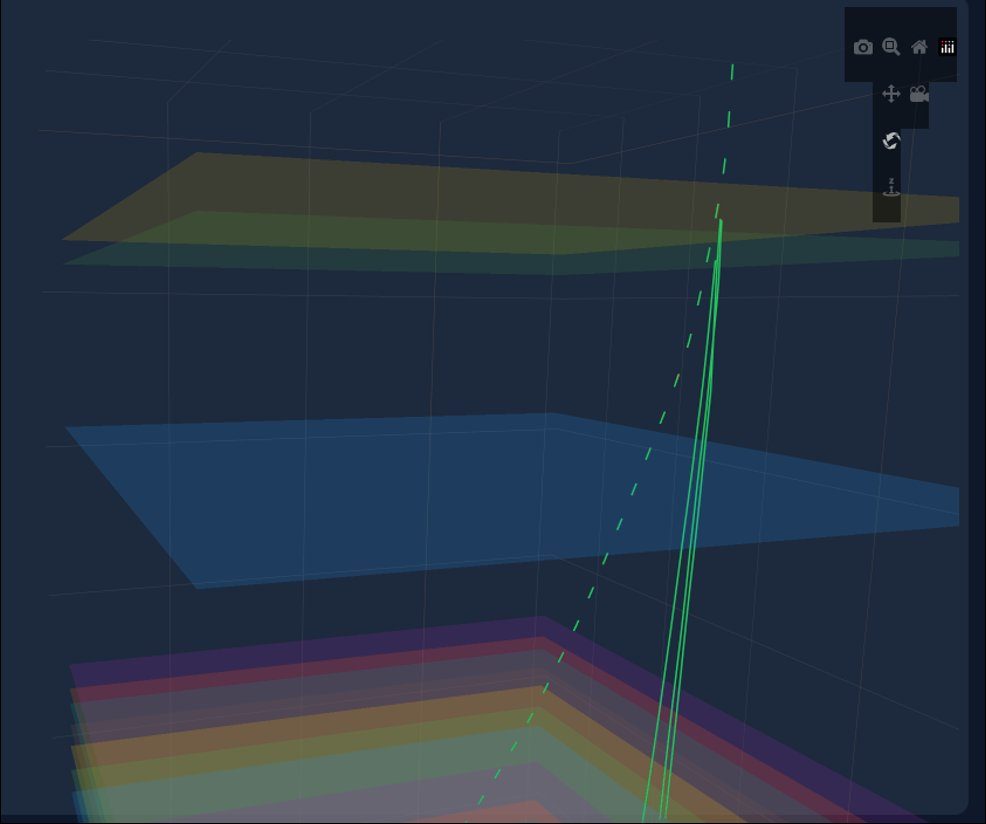
The target well and its offsets plot together in three dimensions with formation overlays, from the surveys in the rig reports or from surveys you upload. Planned and actual trajectories are shown side by side.
The core platform
In the field
The core platform
Engineering modules
Each module has its own inputs, results, charts and PDF report. Cases are saved as named sessions and reloaded later, and a saved session is available to every module.
Enter the mud rheology, drill string, hole program and bit; the software computes the full pressure picture of the well, before and during the run.
Hydraulics →From the survey, string tally, hole program and friction factors, hook loads and surface torque for every operating mode: pick-up, slack-off, rotating on and off bottom, slide drilling and reaming.
Torque and drag →The BHA and drill string modelled in three dimensions to find the critical rotary speeds where axial, lateral and torsional vibrations are excited, including motor-driven bits, RSS, stabiliser placement and WOB effects.
Critical speed →Time-based and depth-based plotting across configurable tracks: depth, WOB and hookload, surface / motor / total RPM, torque, ROP and hydraulics.
Drilling logs →Well Design
Well planning, positional integrity, drilling engineering and execution reporting in one workspace and one data model, from spud to end of well.
The Well Design module →Installation
ABAR runs on machines you control. Rig reports are extracted and kept there.
Note
ABAR works on your own daily rig reports and surveys. It does not supply drilling data. The screens on this page show dummy sample data.
Next
A live session of about forty minutes walks through the full workflow on real reports: extraction, runs, comparison, the engineering modules and the deliverables.
RAK Engineering · rakengine.com/abar/ · support@rakengine.com